How a CRDMO improved on-time quality closure by 24%How a CRDMO improved on-time quality closure by 24%
Results at a Glance
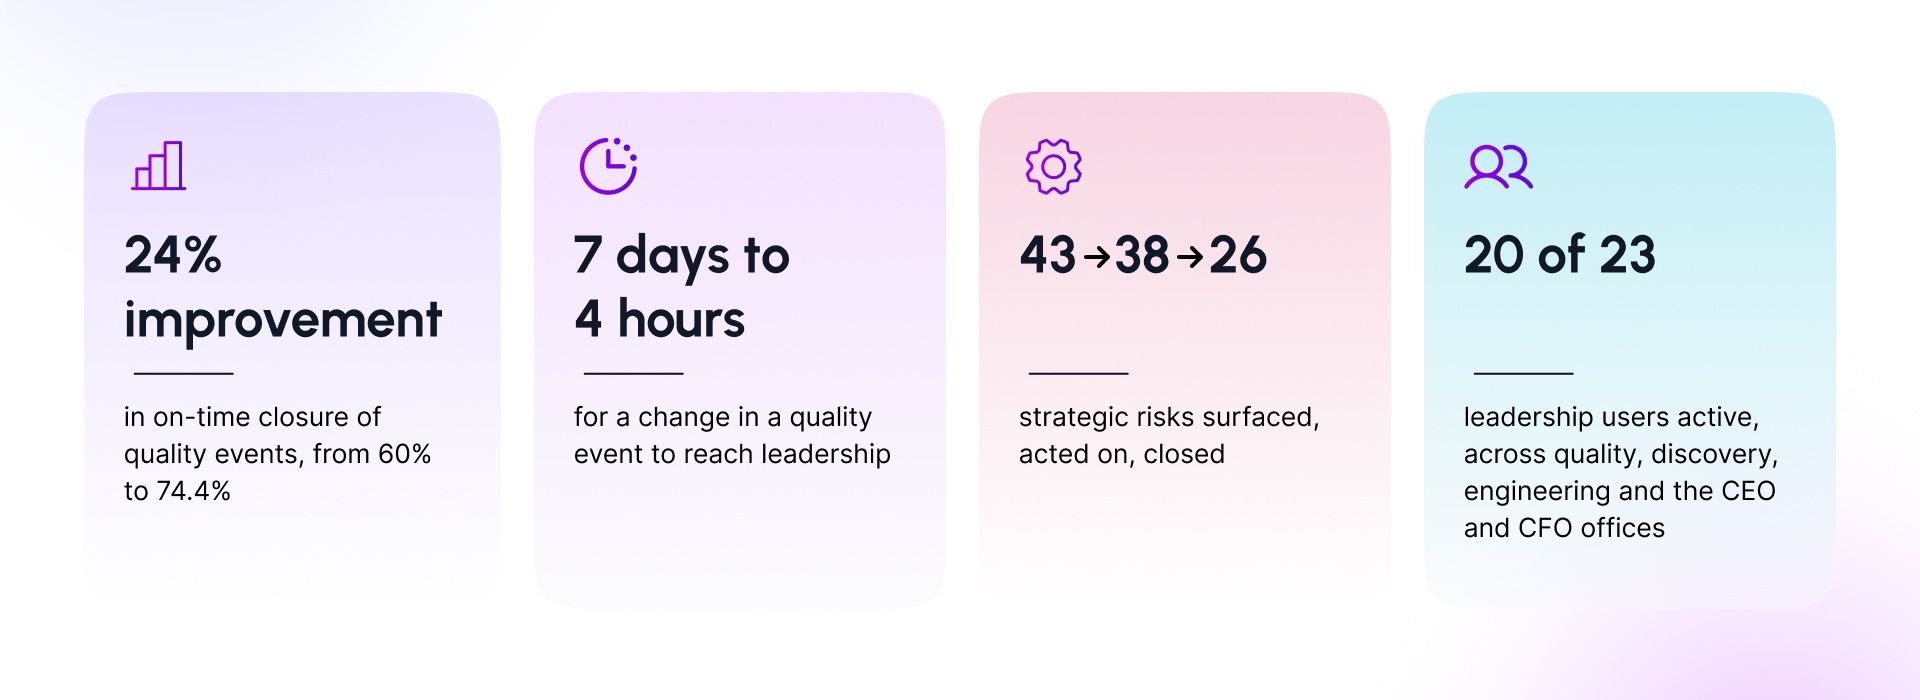
24% improvement in on-time closure of quality events, from 60% to 74.4%. This is the share of quality management system (QMS) events closed within their service level agreement (SLA), comparing the quarter before the control tower with its first quarter. The 24% is a relative gain. It came mainly from planned changes and change controls, the two event types that were performing worst.
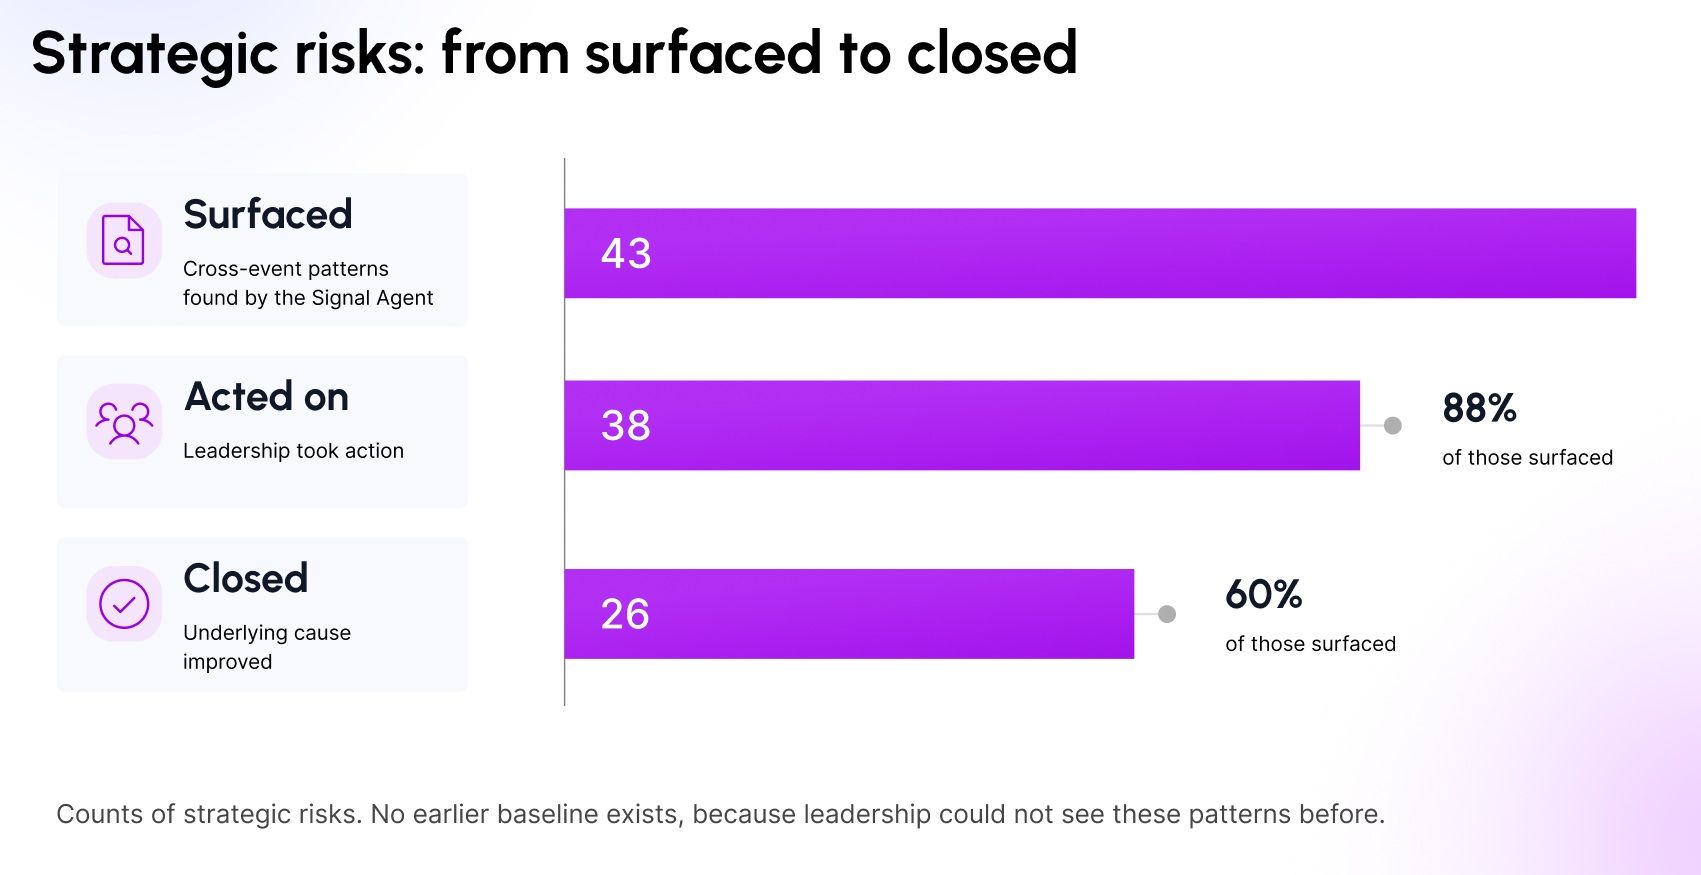
43 strategic risks surfaced, 38 acted on, 26 closed. These are patterns across events that leadership could not see before, so there is no earlier baseline.
8 to 10 hours down to under 1 hour in weekly time a leader spends preparing quality reports. This returns an estimated 2,400 to 6,720 hours a year, the equivalent of 1.1 to 3.1 full-time roles.
A contract research, development and manufacturing organization (CRDMO) with discovery, development and commercial manufacturing sites had quality, manufacturing and engineering data in separate on-premises systems. Coditas built an enterprise data lakehouse and a leadership control tower on top of it. The system is read-only: it shows and ranks, and people act in the source systems.
Events Were Tracked, Patterns Were Not
A CRDMO runs on events. A change control waits 90 days for closure, a deviation 30, and a corrective and preventive action (CAPA) can stay open for more than six months. Each event sat in an operational system and had an owner who knew its status. What nobody tracked was how events combined.
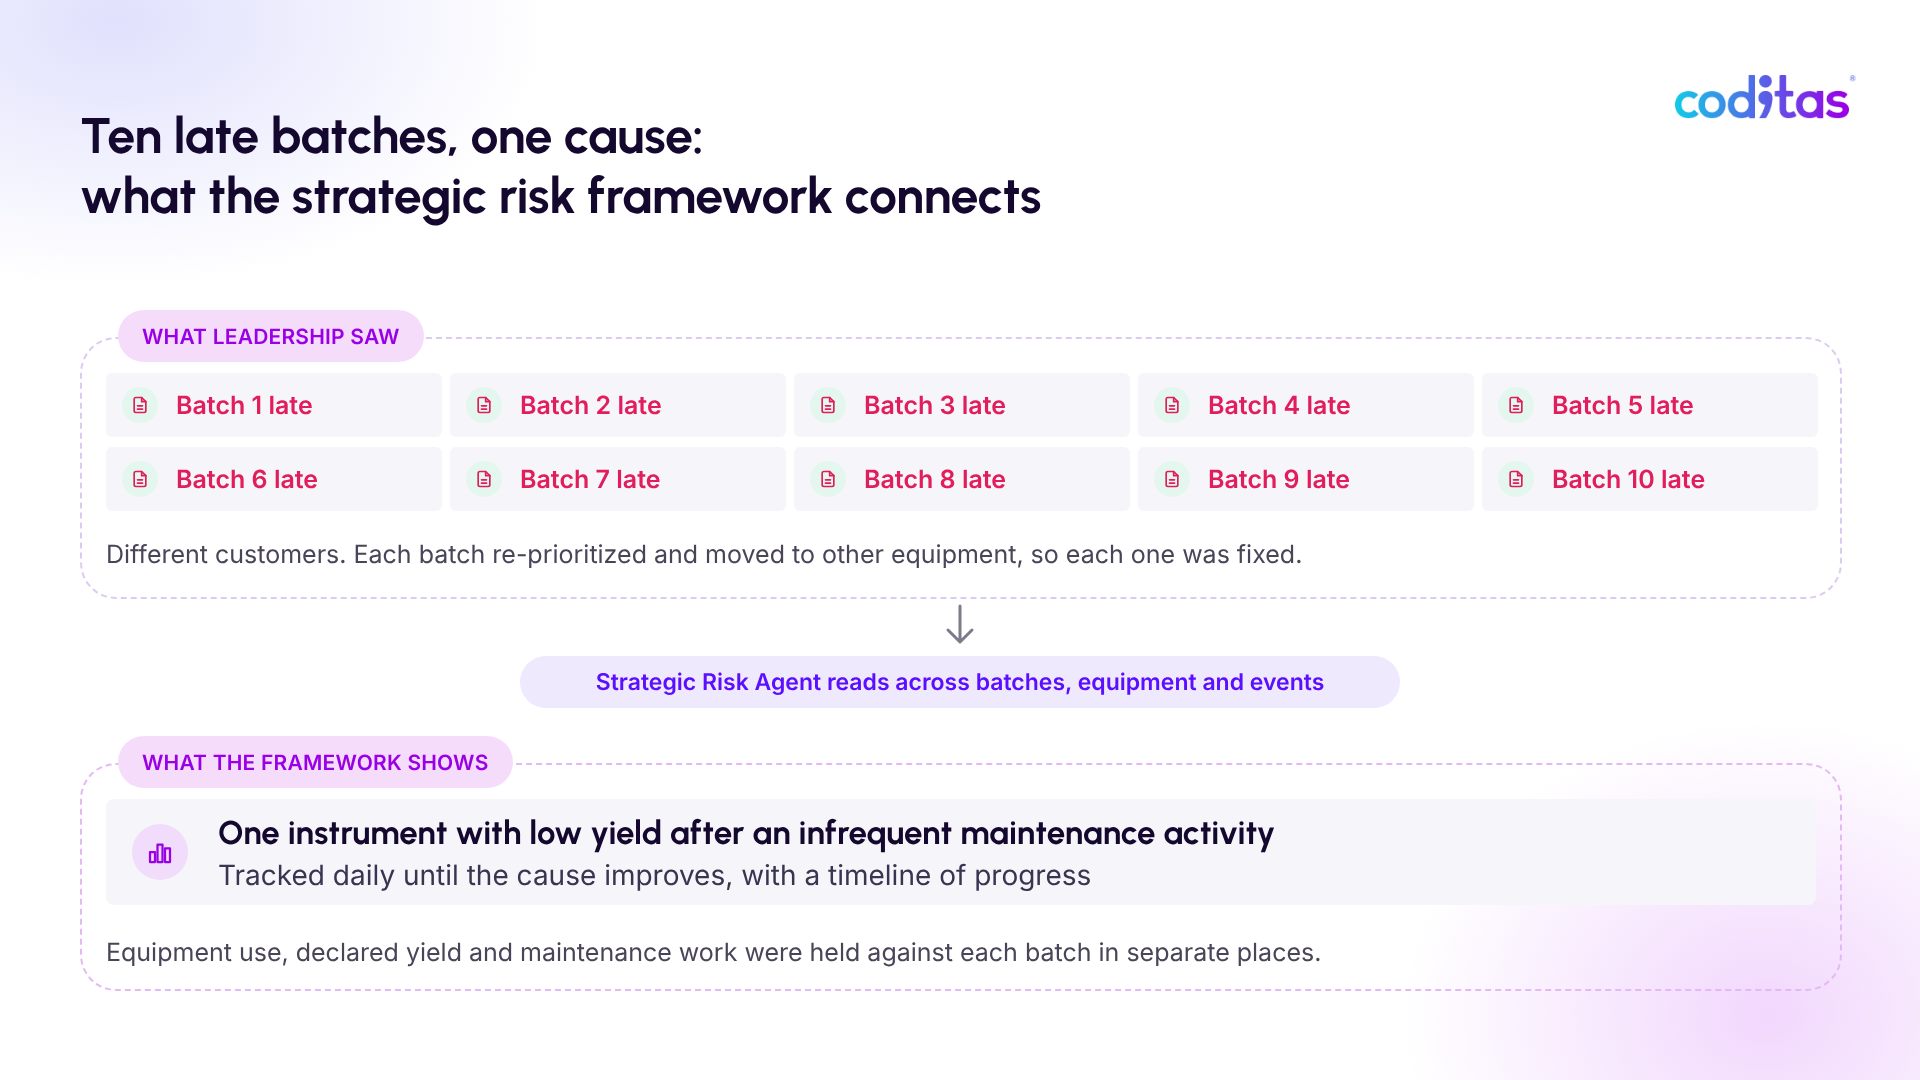
Leadership could see each late batch but not what the late batches had in common. An example: ten batches a month run late, each for a different customer. Operations teams re-prioritize each batch and move it to other equipment, so every batch gets fixed. The shared cause is one instrument whose yield is low after an infrequent maintenance activity, and nobody sees it, because equipment use, declared yield and maintenance work are recorded against each batch in separate places. Leadership sees ten late batches, so the instrument is never the question, and the same batches keep running late. The same gap kept a late CAPA, a late change control and a late batch as three separate reports instead of one picture.
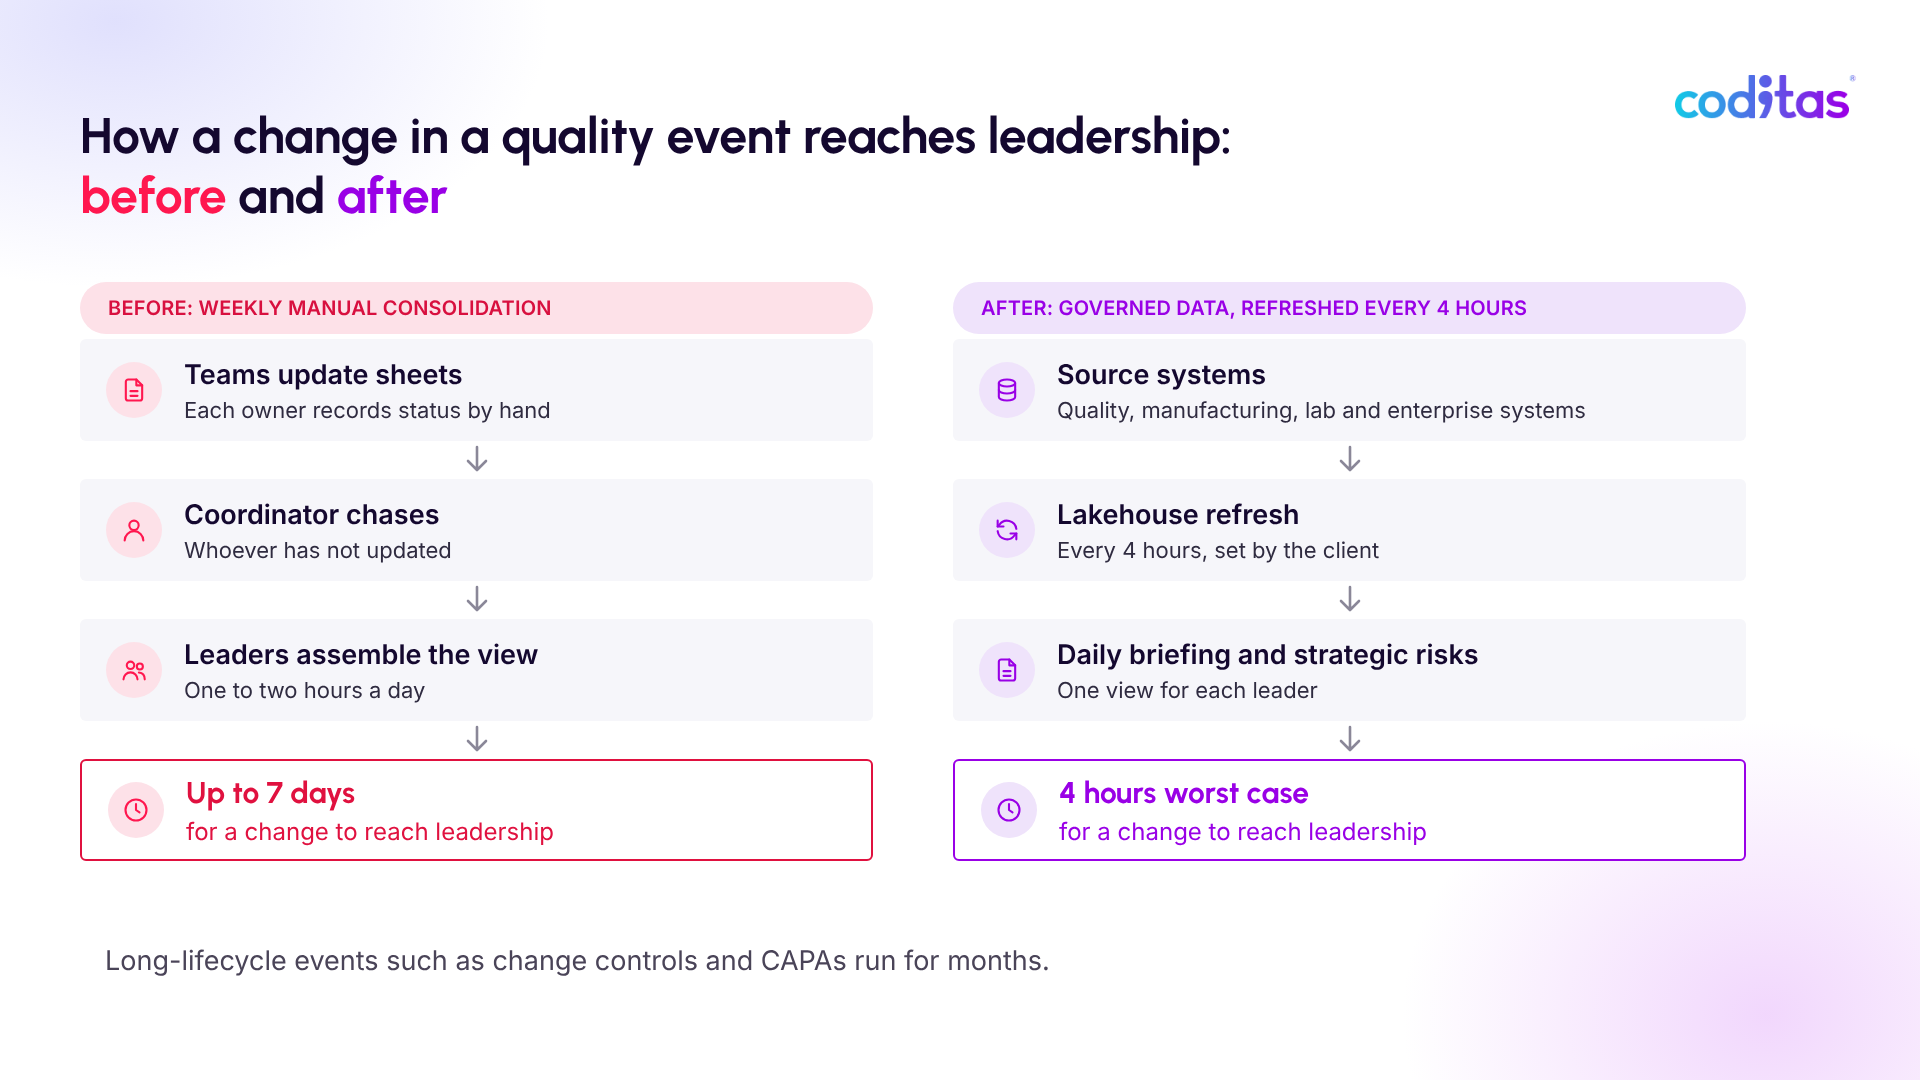
The consolidated view existed only because people built it by hand. Teams updated sheets, a coordinator chased whoever had not, and leaders spent one to two hours a day assembling the picture. A CAPA review pack could take a week to prepare.
The data made this hard to fix. It sat in separate on-premises databases, and the largest had about 1,000 tables. More than 70% of those tables had no created or updated timestamps (which are the standard way a pipeline knows what changed) and deleted records were removed permanently. A manufacturing batch carried seven to eight identifiers across production, dispatch, invoicing and inventory, so a question that crossed systems was a manual research project.
Two constraints applied throughout. Under GxP rules, the tool could not create or alter a quality record. And the client required that data, including data sent to an AI model, stay in the client’s country.
Diagnosis Before Sequencing
The client came to Coditas to give leadership one trusted view across the business. The largest source system belonged to a third-party vendor, so the plan had to work around it. Three questions shaped the plan. Could the data be brought into one place without a rebuild of the production system? Could that data answer a question that crossed systems? And could AI be added in a way that a GxP quality function would accept?
The answers set the order of work. Data came first: a lakehouse that unified the on-premises sources and gave every batch one identity. Leadership views came second, built persona by persona so each function saw its own events first. AI came last and stayed narrow. It answers questions and highlights patterns, but it does not act.
“In a CRDMO, quality assurance almost owns the entire life cycle, from receiving goods from the warehouse through batch record preparation and testing to packing, dispatch and release.” - Neel Gala, Head of Consulting, Coditas
A Lakehouse, a Control Tower and a Governed AI Layer
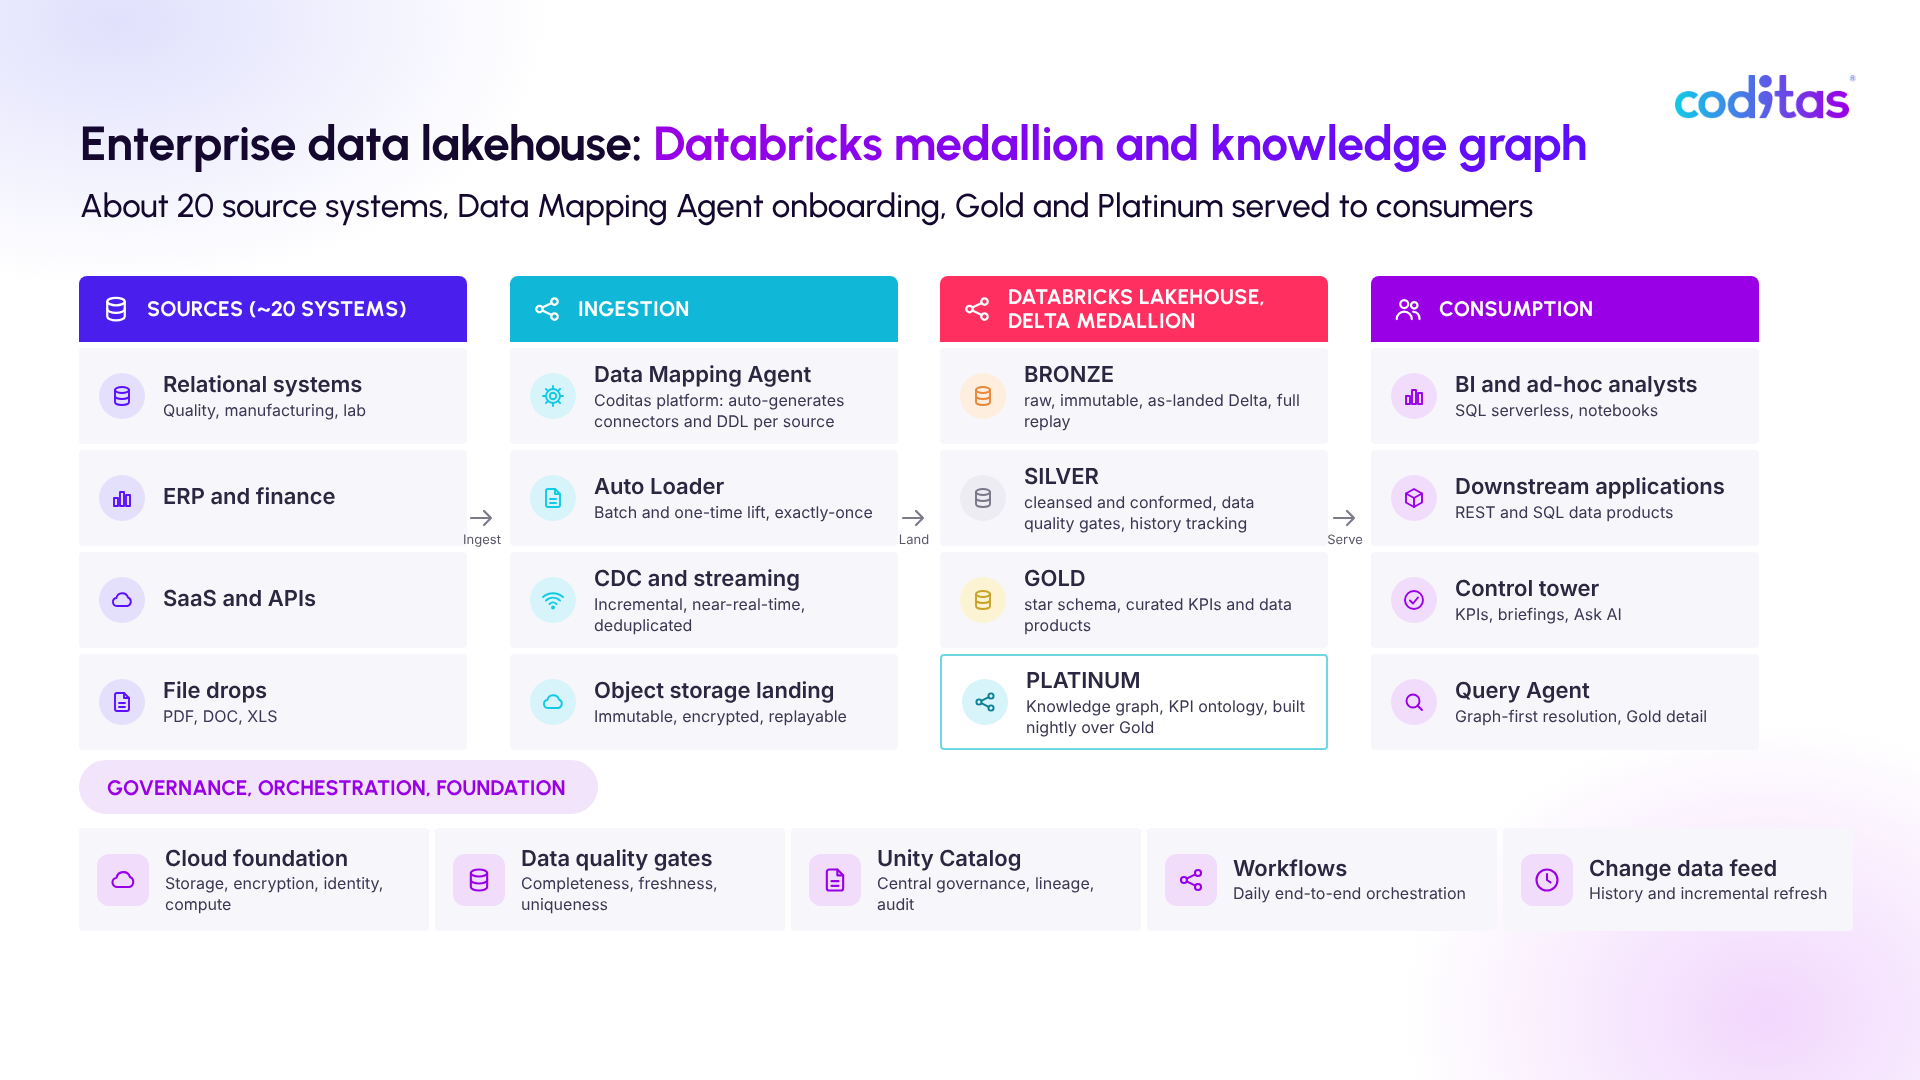
A lakehouse. Coditas unified the sources in a Databricks lakehouse. Data moves through Bronze, Silver and Gold layers, and Unity Catalog governs access. The Platinum layer is a knowledge graph of entities and relationships, so one question can cross systems. A Coditas-built code platform generates the pipelines, and a Data Mapping Agent profiles each source before ingestion, reporting missing keys, missing audit columns and malformed data types. A clean source connects in 10 to 15 minutes and one with edge cases in 2 to 3 hours. Built by hand, the worst case took almost a week. The full load across the connected sources runs in about an hour.
A control tower with a view for each leader. Each persona sees its own function's events, with a daily briefing of what needs attention today. A strategic risk agent reads across quality events, batches and equipment to find the cause behind several symptoms, then tracks that cause daily until it improves. Each persona went live with the briefing first, so users learned the data before they were asked to trust a pattern.
A strategic risk card shows what the framework adds. One card might report that an instrument type is running below its expected occupancy, that its downtime is far above its monthly allowance, and that an equipment change control has been open past its 90-day SLA. Each signal alone would be one line on one report. Together they are a risk that points to a cause, and the card stays open until every correlated signal resolves.
“Previously they were fixing the batch instead of the equipment. They were fixing side effects, not the core problem. These risks point them to the core problem.” - Neel Gala, Head of Consulting, Coditas
A governed AI layer. An AI assistant answers questions the interface does not already show, such as why a batch is delayed or how complaints have trended, and it chooses the right chart for the answer. Leaders’ questions ask for connections across structured data, not advanced reasoning, so Coditas scored candidate models on answer quality, chart choice and latency as well as cost, and only considered models that met the client’s requirement that data stay in the client’s country. A cost-optimized model met the quality bar for these questions. Every model call runs through a gateway in the Databricks platform, so the client can change models without changing the application.
Engineering that Shaped the Outcome
Timestamps only where they pay. A pipeline that loads only what changed needs a created and updated time on every row. Changing more than a thousand tables was a program of its own, with its own risk. The large tables, where a day's data is big, got timestamps. The small ones, a few thousand rows each, are reloaded in full every day. This avoided a system-wide change and kept incremental loading on the tables where volume is highest.
Detecting deletions the source does not record. The source removed records permanently, with no inactive flag. Marking records inactive instead would preserve an audit trail, but changing the source to do it was a bigger job than adding timestamps. Coditas built a mechanism inside the pipeline that detects hard deletes, so the lakehouse stays correct with no change to the source system.
Moving the firewall. The firewall sat in a different region from the lakehouse, and every query had to cross that gap. Because the delay came from the infrastructure, it applied to every query, and a full load took almost 53 hours. The firewall belonged to the client’s infrastructure team, and Coditas worked with that team to make the move. The same load now runs in about an hour.
“One query to fetch ten records could take 20 or 30 minutes, and sometimes it would time out. It was binary: if the firewall moved, it worked, and if it did not, the lakehouse could not exist.” - Shubham Upadhyaya, Data Architect, Coditas
Separating a quality release from the physical dispatch. Leadership wanted one measure of on-time release by quality assurance. A customer hold or a late vehicle breaks that measure, and counting the later date as a quality delay blames the wrong team. The source recorded two events, marked ready for dispatch and dispatched, but not as separate dates. Coditas recovered the ready-for-dispatch date from the system’s audit logs, so the measure now shows quality assurance’s own release time.
Adoption is a Layer of the Build, Not a Rollout That Follows It
The client ran its own compliance testing, and the application is available only inside the client's network. A user without permission cannot open the portal. The client's testing tool can test an application but not an AI agent, so Coditas built a library of about 450 positive and negative prompts, run before every major and minor release. Positive prompts confirm that the agent answers what it should. Negative prompts confirm that it blocks what it must not release, whether asked directly or by a side route. The library and its results became part of the evidence package Coditas gave the client.
Each persona went live with a daily briefing before anything more complex, so leaders learned their own data first and were asked to trust a pattern or an AI answer only after that. A few program managers on the client side acted as the bridge, explaining how each feature helped in a leader’s day. Coditas helped each user build a use case for each feature and showed them how to put questions to the AI assistant.
What Changed After the Control Tower Went Live
On-time quality event closure: 24% improvement. In the quarter before the control tower, 60% of quality events closed within SLA. In its first quarter live, 74.4% did. The comparison covers the same seven QMS event types, and two of them accounted for most of the improvement.
Visibility: 7 days to 4 hours. Several quality event types run for months, and leadership tracked them through weekly updates. Leaders now see current status on a 4-hour data refresh. The interval matches the client’s requirement, not a technical limit: the platform can sync in real time, but events that run for months gain nothing from real-time tracking.
Strategic risks: 43 surfaced, 38 acted on, 26 closed. Before the framework, leadership could not see combinations of events that created a larger problem, so there is no earlier count to compare with. The framework surfaced 43 risks, leadership acted on 38 and 26 have been closed. Each is tracked daily until its cause improves.
Time recovered from reporting. Leaders spent one to two hours a day, 8 to 10 hours a week, assembling quality reports. The delivery team's working estimate is an average of 6 to 8 hours a week per leader. With the numbers on screen, a report takes 30 minutes to an hour, and the AI assistant answers anything the interface does not show. Coditas estimates that each leader recovers about 5 to 7 hours a week. Assuming 10 to 20 people prepare these reports, over 48 working weeks, that is about 2,400 to 6,720 hours a year, or 1.1 to 3.1 full-time roles at 2,160 hours a year.
What Next
The client now manages quality and operations from one governed view instead of weekly sheets. Leadership attention moved from symptoms to causes: the question changed from "why is this batch late" to "what is making these batches late". The data foundation and the AI are one investment. The AI answers well because the lakehouse gives every question structured data and context, and new sources join through the Data Mapping Agent in hours, so each new persona costs less than the last.
The client has asked Coditas to extend the platform to further functions across the organization, and a second build that turns this visibility into direct operational improvement is underway.
Lessons for CRDMO Leaders Starting an AI Program
Make the data readable by AI before building on it. An AI system can only reason about what the data records. If a record has no stable identifier, no time of last change, and no trace of deletion, an agent cannot tell what changed, when, or whether it is looking at the same record it saw yesterday. Risk detection depends on exactly that history. Timestamps and audit columns can be added to a source later. Identifiers cannot. Before you start, confirm that every source can answer three questions: which record is this, what changed, and when.
“Have one batch ID and propagate it across all the places. Timestamps can be added retrospectively, but standardization of identifiers may not be possible in retrospect.” - Shubham Upadhyaya, Data Architect, Coditas
Carry one identifier through the lifecycle. In CRDMO operations, a single batch typically picks up a new identifier in each system it passes through, across production, dispatch, inventory, and invoicing. One batch identifier carried through all of them removes a large share of the integration work. It is far easier to set before systems multiply than to retrofit afterward.
Start read-only, and prove it before it acts. The first questions leaders ask are lookups and comparisons across batches. A read-only assistant on structured data answers them, and a library of positive and negative test prompts shows whether it can be trusted before it is allowed to do more.
Coditas is an enterprise AI transformation and product engineering company. For life sciences and pharma teams, we take AI from the first decision to agents working inside R&D, quality, safety and commercial workflows. Each agent runs on your infrastructure, your data and your models, under human approval, with an audit trail and measured results. We build it. You own it.
To explore what this could look like in your environment, connect with us at health@coditas.com
Build an AI Strategy Your Teams Can Act On

Ashutosh Zatke
Director - Growth Strategy
When you win, we win.
Our Offices