
Dhirva Makadiya
Tired of flying blind when it comes to your VPN? It's time to give your network infrastructure the attention it deserves. By combining the power of Pritunl, Filebeat, Elasticsearch, and Kibana, you can transform your VPN from a black box into a transparent, manageable, and secure system.
Imagine having a real-time view of user activity, detecting anomalies, and troubleshooting issues before they become major headaches. That's exactly what this guide will help you achieve.
We'll walk you through the process of setting up a robust VPN monitoring solution, from installing the necessary components to creating insightful dashboards. Whether you're a seasoned sysadmin or a curious network enthusiast, this guide has something for everyone.
Let's get started!
What is a Pritunl Server?
Pritunl is a powerful, open-source VPN server that simplifies the management of remote access networks. It offers a user-friendly web interface for creating organizations, users, and servers, making it accessible to both technical and non-technical users.
Key features of Pritunl include:
- Easy setup and management: A web-based interface streamlines the configuration process.
- Strong security: Supports various authentication methods and encryption protocols.
- Scalability: Handles growing numbers of users and connections.
- Flexibility: Works with multiple platforms and clients.
- Open-source: Benefits from community contributions and customization.
Benefits of Pritunl Server Over Traditional VPNs
While traditional VPNs serve their purpose, Pritunl offers several advantages:
- Centralized management: Easily manage users, servers, and policies from a single console.
- Enhanced security: Built-in features like two-factor authentication and role-based access control.
- Scalability: Easily add or remove servers to accommodate growing user needs.
- Cost-effective: Open-source nature and flexible deployment options.
- User-friendly interface: Simplifies administration for non-technical users.
Understanding the Players
Before we dive into the setup, let's quickly familiarize ourselves with the key players in this operation:
- Pritunl: Our VPN server of choice. It's user-friendly, open-source, and offers a solid foundation for secure remote access.
- Filebeat: A lightweight shipper that collects logs from your Pritunl server and sends them to Elasticsearch.
- Elasticsearch: The heart of our data storage and analysis. It indexes logs for fast and efficient searching.
- Kibana: The visualization layer. It lets you explore your VPN data through interactive dashboards and graphs.
By working together, these tools create a powerful ecosystem for monitoring and managing your VPN.
Deploying the Pritunl Server
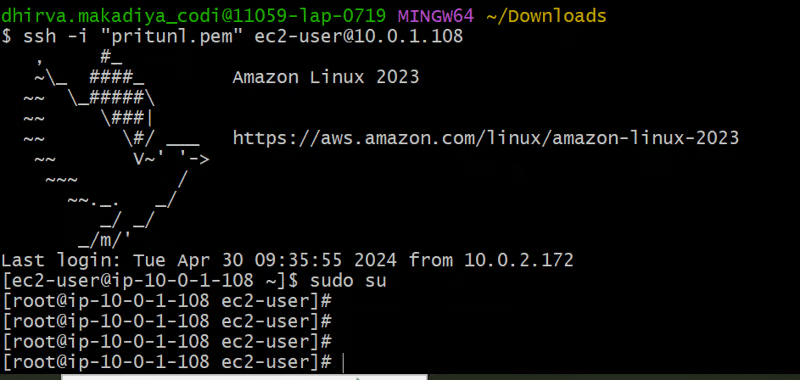
1. Launching EC2 Instances
This step involves creating two server instances within your AWS Virtual Private Cloud (VPC). We'll need one public server to run the Pritunl server software and a private server to test connectivity later.
Here's what you'll need to consider:
- Instance Type: Choose an instance type with sufficient resources for Pritunl and your expected usage.
- Security Groups: Configure security groups to allow inbound SSH access to the public server and restrict access to the private server.
- Networking: Ensure both instances are launched within the same VPC to facilitate communication later.
While the specifics of launching instances vary depending on your AWS interface, the general steps involve:
- Accessing the EC2 service in your AWS Management Console.
- Selecting "Launch Instance".
- Choosing an appropriate Ubuntu 22.04 AMI (Amazon Machine Image).
- Configuring instance type, security groups, and networking settings as mentioned above.
- Launching the instance.
Repeat the above steps to launch a separate private server within the same VPC.
2. Create an Installation Script for Pritunl
Once both instances are running, let's create a script to automate the installation of Pritunl and MongoDB on the public server. Create a new bash script named <code>install_pritunl.sh</code> with the following content to set up Pritunl and MongoDB:
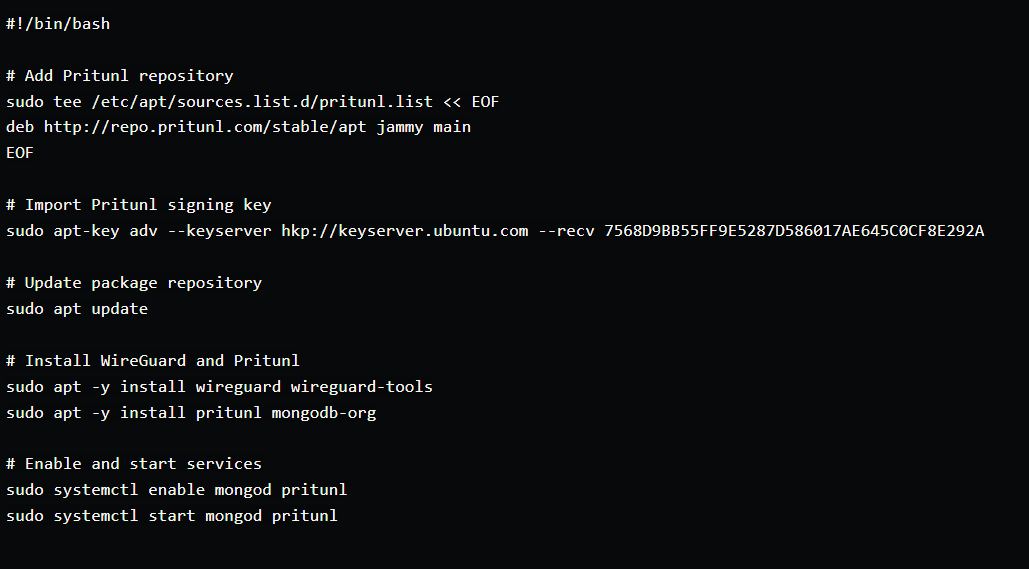
- <code>#!/bin/bash</code>: This line specifies the interpreter to be used for running the script (bash in this case).
- <code># Add Pritunl repository</code>: This line adds the Pritunl repository to your system's package sources list. This allows you to install Pritunl packages using apt.
- <code># Import Pritunl signing key</code>: This line imports the Pritunl signing key, which is necessary to verify the authenticity of packages downloaded from the Pritunl repository.
- <code># Update package repository</code>: This line updates the package list to reflect the newly added Pritunl repository.
- <code># Install WireGuard and Pritunl</code>: This line installs both WireGuard (the underlying VPN protocol) and Pritunl server software.
- <code># Enable and start services</code>: These lines enable the <code>mongod</code> (MongoDB) and pritunl services to start automatically on system boot and then start them immediately.
Save the script using <code>Ctrl+O</code> and exit the editor with <code>Ctrl+X</code>. Run the script using the following command: <code>. ./install_pritunl.sh</code>
3. Configure Pritunl Server
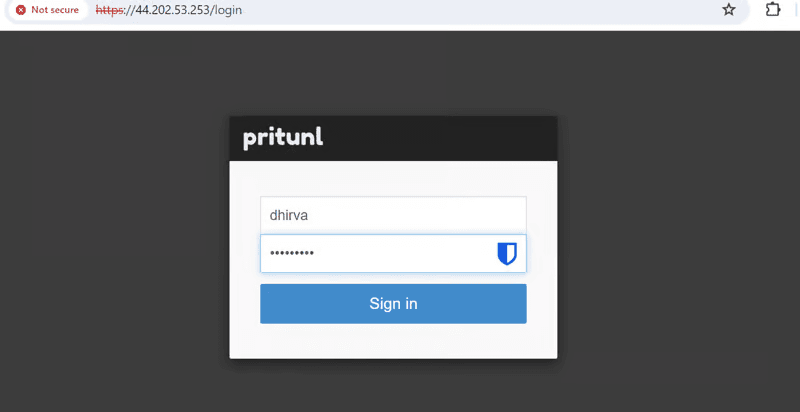
- Access the Pritunl web interface using the public IP over HTTPS.
- Sign up.
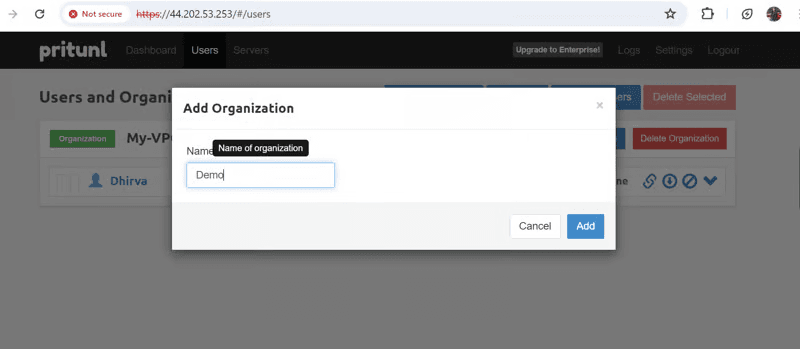
- Create organization
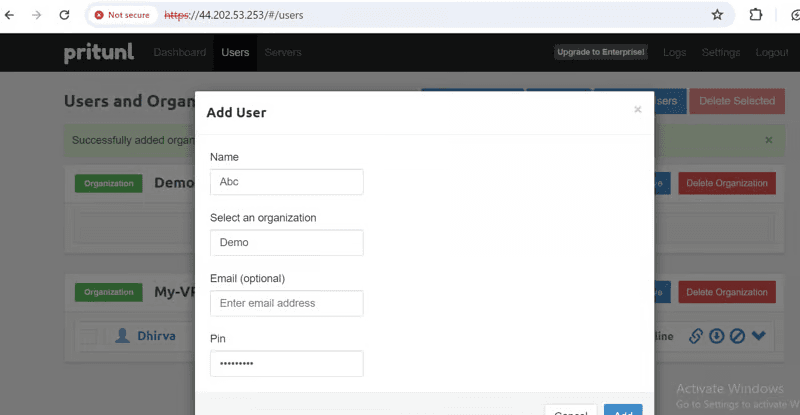
- Create a user inside the organization that you created.
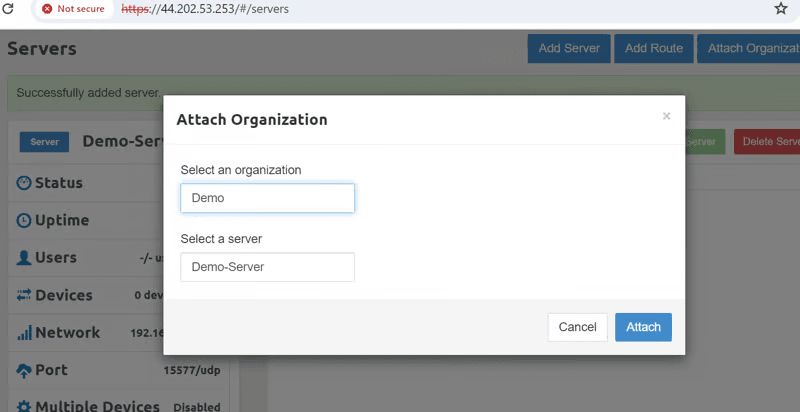
- Add a server
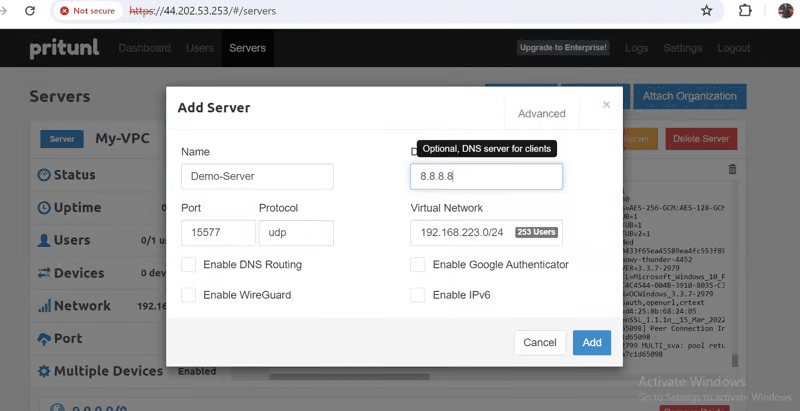
- Attach the server to the organization that you created.
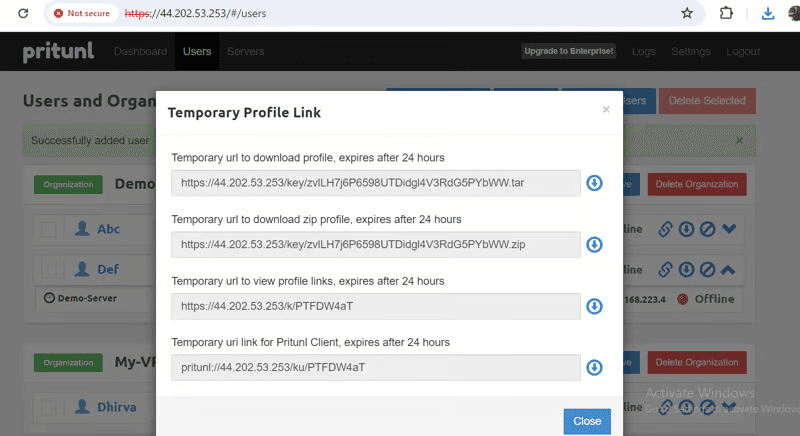
- Download the user's profile by going to the temporary profile link and downloading the zip file. Unzip that OVPN file.
- Download OpenVPN if not present.
- Inside OpenVPN add the user's profile and connect to the Pritunl server. Add username and password of pritunl login. Add a response pin which is set when we create a user.
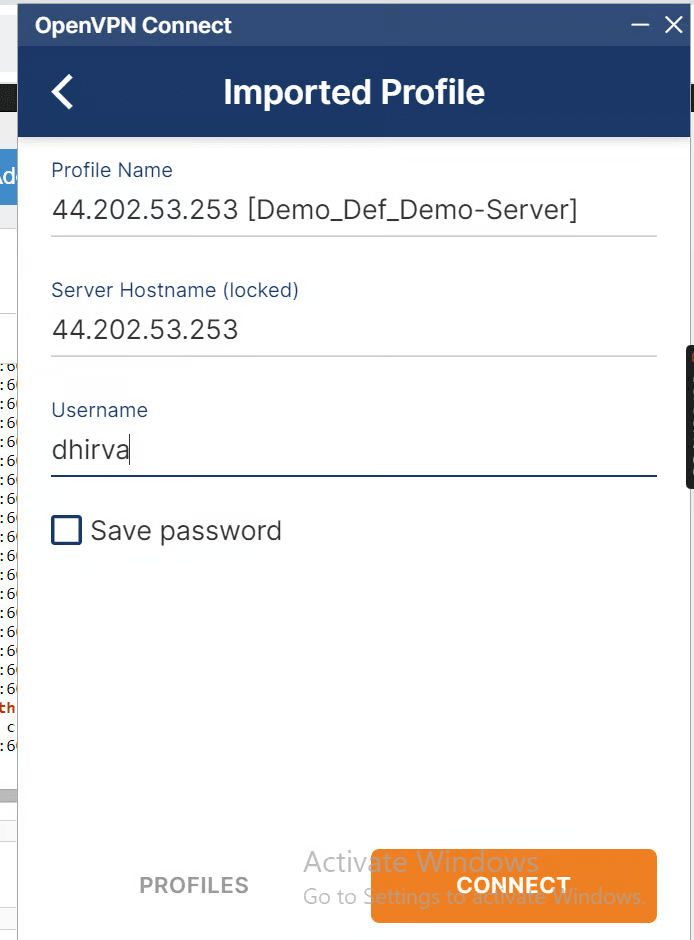
- Successfully connected to the Pritunl VPN.
- Now we will test whether we can connect(SSH) our private server which is in the same VPC network when we are connected to pritunl VPN.
We can successfully SSH to our private server if they are in the same network and connected to our Pritunl VPN server.
Integrating Pritunl Logs with Elasticsearch and Kibana using Filebeat
Install Elasticsearch
We'll begin by installing Elasticsearch, the heart of our data storage and analysis system. Here's the consolidated script for the process:
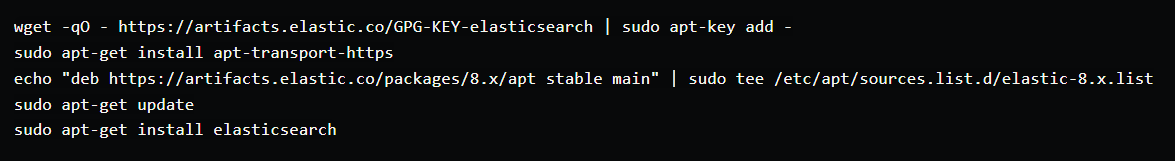
- <code>wget -qO - https://artifacts.elastic.co/GPG-KEY-elasticsearch | sudo apt-key add -</code>: Downloads the official Elasticsearch GPG key to the system's trusted keyrings. This ensures the authenticity of packages downloaded from the Elasticsearch repository.
- <code>sudo apt-get install apt-transport-https</code>: Installs the apt-transport-https package, which is required to use HTTPS repositories.
- <code>echo "deb https://artifacts.elastic.co/packages/8.x/apt stable main" | sudo tee /etc/apt/sources.list.d/elastic-8.x.list</code>: Adds the official Elasticsearch repository to your system's package sources list. Replace "8.x" with the specific version you want to install if needed.
- <code>sudo apt-get update</code>: Updates your system's package lists to reflect the newly added repository.
- <code>sudo apt-get install elasticsearch</code>: Finally, installs the Elasticsearch package using apt.
2. Configure Elasticsearch
Now that Elasticsearch is installed, let's fine-tune it for our VPN monitoring needs. We'll modify the default configuration file (/etc/elasticsearch/elasticsearch.yml) with the following settings:
(Paste the following configuration block or modify the existing settings within the file)
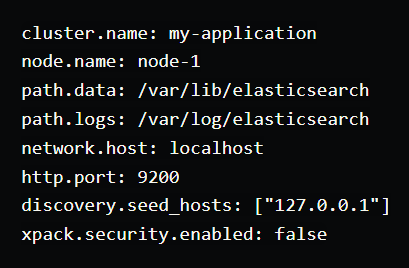
- <code>cluster.name</code>: Defines the name of your Elasticsearch cluster. Replace <code>my-application</code> with a descriptive name for your specific setup.
- <code>node.name</code>: Specifies the name of this Elasticsearch node. Adjust this if you have a multi-node cluster.
- <code>path.data</code>: Sets the directory for storing Elasticsearch data files.
- <code>path.logs</code>: Specifies the directory for storing Elasticsearch logs.
- <code>network.host</code>: This setting controls which IP addresses Elasticsearch binds to. By default, it listens on <code>localhost</code> only. Uncomment and modify it to allow access from specific IP addresses or remotely if needed.
- <code>http.port</code>: The port on which Elasticsearch listens for HTTP traffic. The default is 9200. Uncomment and adjust if needed.
- <code>discovery.seed_hosts</code>: This setting defines the initial contact points for cluster discovery. For a single-node setup, keep <code>127.0.0.1</code>. Update it for multi-node clusters. xpack.security.enabled: We'll disable security in this example for simplicity. Consider enabling it for production environments to enhance security.
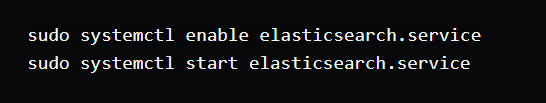
Start and enable the Elasticsearch service using the following commands:
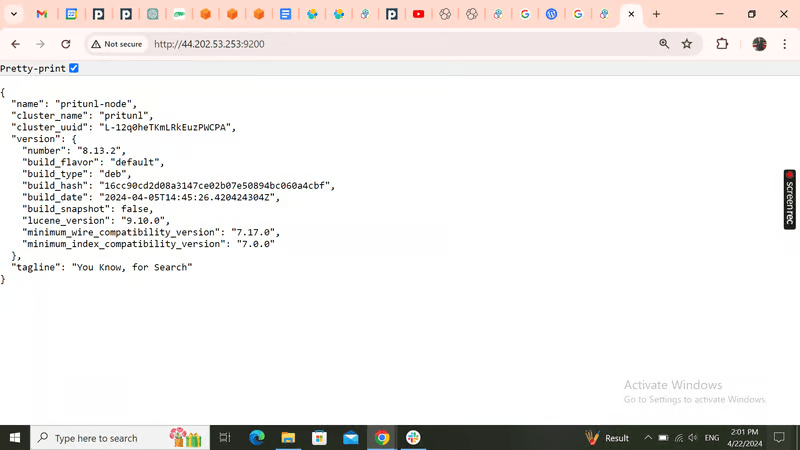
You can verify if Elasticsearch is running by accessing the web interface at <code>http://<your_public_ip_address>:9200</code> (replace with your server's public IP if you allowed remote access). You should see a basic welcome message if successful.
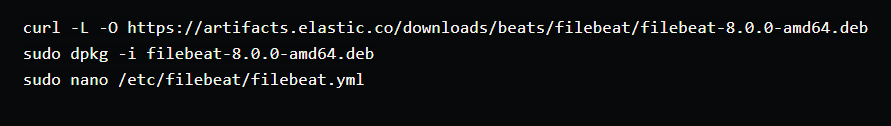
3. Install and Configure Filebeat
Now that Elasticsearch is configured to receive logs, let's install and configure Filebeat to act as a log shipper. Filebeat will efficiently collect Pritunl logs and send them to Elasticsearch for centralized storage and analysis.
- Install and configure Filebeat to ship logs to Elasticsearch:
- Example filebeat.yml configuration:
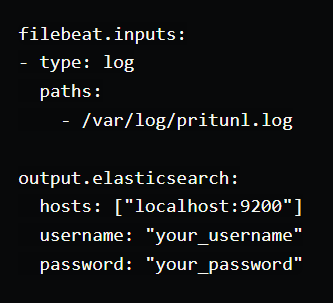
<code>filebeat.inputs</code>: This section defines the log sources Filebeat will monitor.
<code>type: log</code>: Specifies the type of input as a log file.
<code>paths</code>: Defines the paths to the log files Filebeat should read. Adjust /var/log/pritunl.log with the actual location of your Pritunl log file.
<code>output.elasticsearch</code>: This section defines the output destination for collected logs.
<code>hosts</code>: Specifies the hostname and port of your Elasticsearch instance. Replace <code>localhost:9200</code> with the appropriate details if you configured Elasticsearch for remote access.
<code>username</code> and <code>password</code>: These lines are commented out as we disabled security in the previous step. If you enabled security in Elasticsearch, uncomment these lines and provide your credentials.
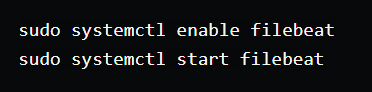
- Start and enable Filebeat:
4. Install and Configure Kibana
Now that Filebeat is sending Pritunl logs to Elasticsearch, let's install and configure Kibana, the visualization platform for the ELK Stack. Kibana will allow us to create dashboards and analyze these logs for valuable insights into VPN activity and potential issues.
- Install and configure Kibana for log visualization:
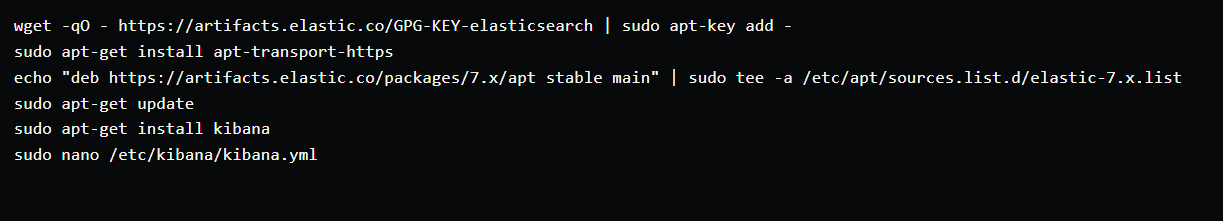
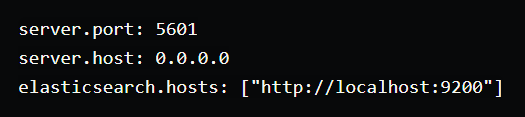
- As an example, paste the following configuration into the <code>kibana.yml</code> file:
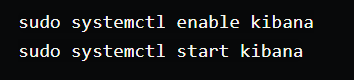
- Save the file and start the Kibana service:
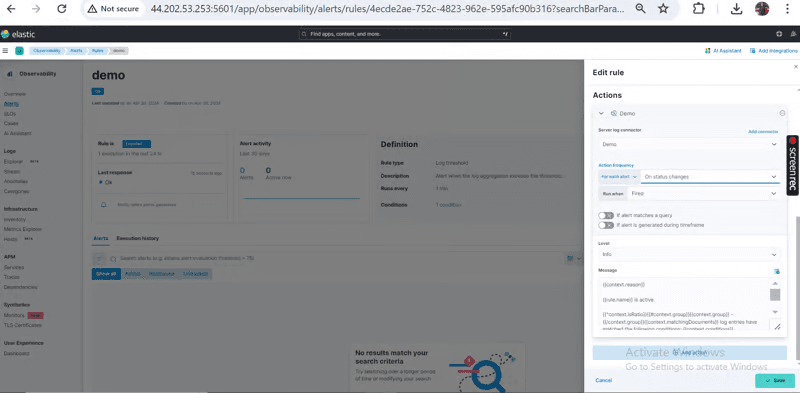
5. Setting Up Alerts in Kibana
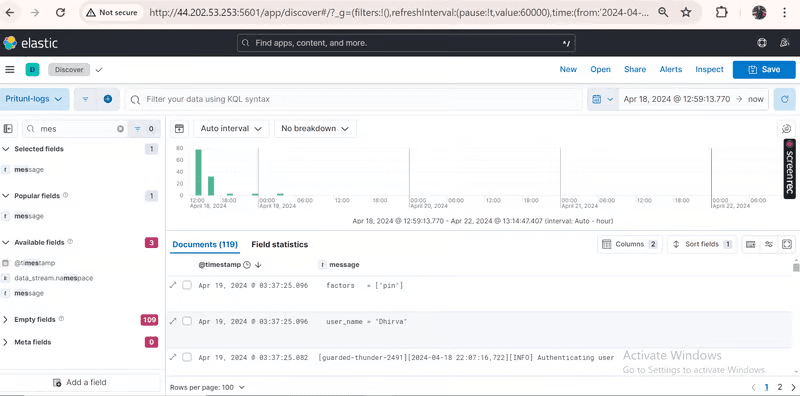
- Access Kibana at http://public-ip-address:5601.
- Navigate to Discover and configure the message and timestamp fields.
- In Observability, go to Alerts > Manage Rules.
- Create a new rule with conditions based on Pritunl logs (e.g., Authenticating user).
- We will create a rule that whenever a user connects to our Pritunl VPN server we should get an alert.
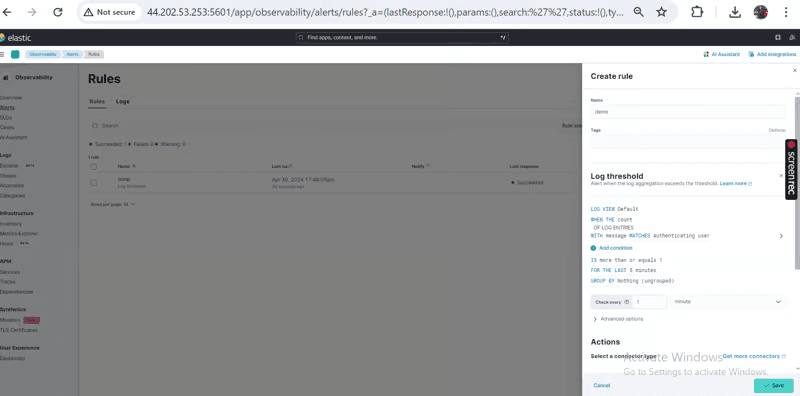
- Add actions to activate alerts (e.g., add server log)
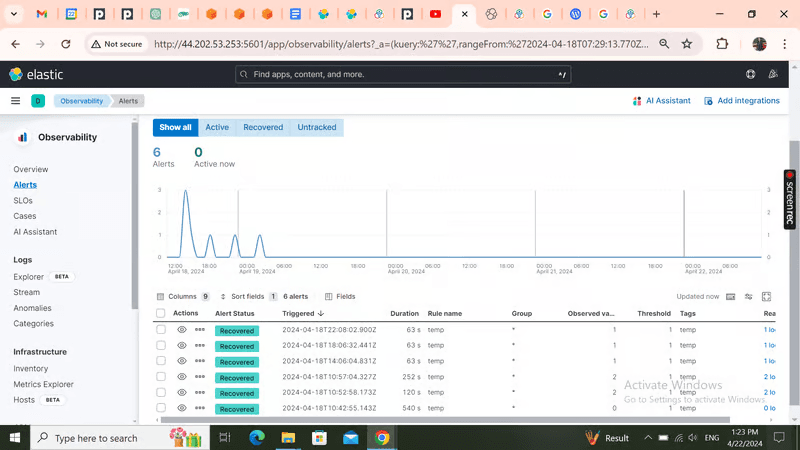
- Logs dashboard and Triggered alerts.
Conclusion
Finally, you've successfully built a robust VPN monitoring solution using Pritunl, Filebeat, Elasticsearch, and Kibana. By following these steps, you've gained the ability to:
- Centralize VPN management: Easily manage users, servers, and policies through the Pritunl web interface.
- Collect and store VPN logs: Efficiently gather and store Pritunl logs using Filebeat and Elasticsearch.
- Visualize VPN activity: Utilize Kibana to create insightful dashboards and analyze log data.
- Proactive monitoring: Set up alerts to be notified of critical events or anomalies.
This comprehensive setup provides valuable insights into your VPN's performance, security, and user activity. By leveraging the power of the ELK stack, you can make data-driven decisions to optimize your VPN infrastructure and protect sensitive information.
Happy monitoring and secure VPN access!